Plasmid (plasmid.mac)
Table of contents
Overview
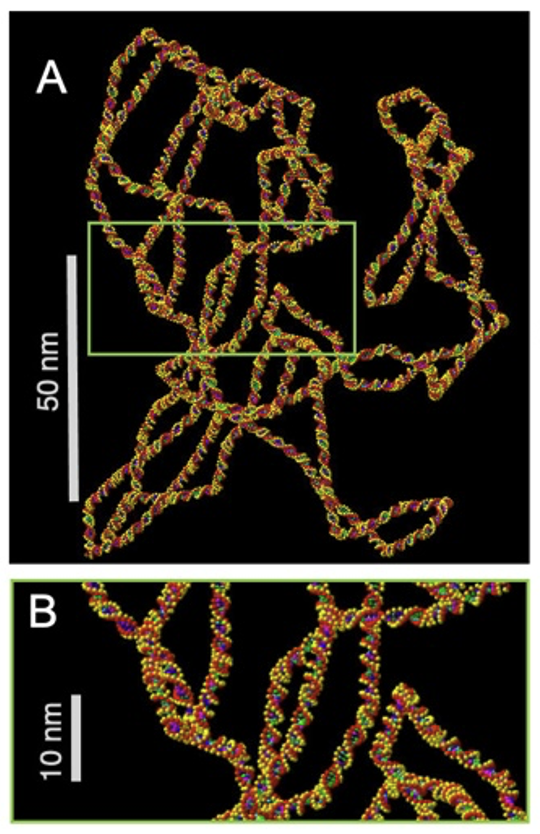
The example simulates the irradiation of a cube of liquid water (side 4.84 um) containing around 10000 plasmids (pBR322, 4367 base pairs each) in a supercoiled conformation and randomly oriented.
Geometry
Plasmid geometry is implemented in the provided macro file plasmid.mac. The file plasmid_4367.txt describes the atom positions in a single plasmid, and the file prisms_plasmids_positions_500ngpul.txt contains all plasmid positions in the irradiated volume.
Radical kill distance and direct interaction range are set to 9 nm and 5.5 angstrom, respectively.
# Geometry: size of World volume
/world/worldSize 4.84 um

# Geometry: creation
#  - Side length for each placement
/dnageom/placementSize 200 200 200 nm
#  - Scaling of XYZ in fractal definition file
/dnageom/fractalScaling 1 1 1 nm
#  - Path to file that defines placement locations
/dnageom/definitionFile geometries/prisms_plasmids_positions_500ngpul.txt
#  - Set placement volumes
/dnageom/placementVolume prism geometries/plasmid_4367.txt

# Geometry: distance from base pairs at which radicals are killed
/dnageom/radicalKillDistance 9 nm

# Geometry: deposited energy accumulation range limit to start recording SBs from direct effects
/dnageom/interactionDirectRange 5.5 angstrom
The chromosome as region of interest for damage analysis is defined using:
/chromosome/add plasmid box 2.21 2.21 2.42 0 0 0 um

Examples of plasmid geometries, from ref. [1]
Particle source
A plane square source of protons is used, shooting a parallel beam.
# Source geometry
/gps/pos/type Plane
/gps/pos/shape Square
/gps/pos/centre 0 0 -2.42 um
/gps/pos/halfx 2.21 um
/gps/pos/halfy 2.21 um

# Source particle, energy and angular distribution
/gps/particle proton
/gps/energy 3 MeV
/gps/direction 0 0 1

# Beam on
/run/beamOn 10
Damage model
Direct damage model sets 17.5 eV for the energy threshold. A probability of 65% is set for the indirect induction of strand break.
/dnadamage/directDamageLower 17.5 eV
/dnadamage/directDamageUpper 17.5 eV

/dnadamage/indirectOHBaseChance 1.0
/dnadamage/indirectOHStrandChance 0.65
/dnadamage/inductionOHChance 0.0

/dnadamage/indirectHBaseChance 1.0
/dnadamage/indirectHStrandChance 0.65
/dnadamage/inductionHChance 0.0

/dnadamage/indirectEaqBaseChance 1.0
/dnadamage/indirectEaqStrandChance 0.65
/dnadamage/inductionEaqChance 0.0
Results
Output (see analysis) is analysed by using the plasmid.C ROOT macro file.
It calculates damage statistics and plots the five following quantities:
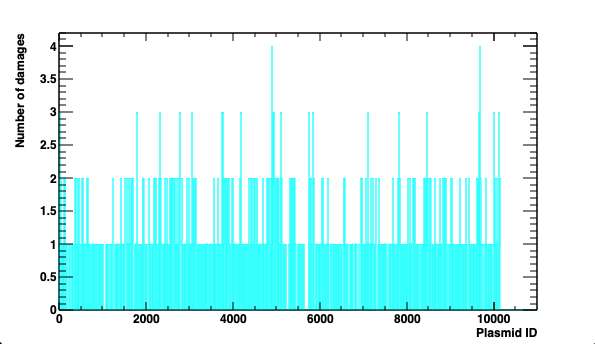
- distribution of damage per plasmid
- number of direct SSB per event
- number of direct DSB per event
- percentage of number of damages per plasmids
- percentage of number of damages per event

Example of damage distribution in the plasmid population.
Reference
[1] Quantitative analysis of dose dependent DNA fragmentation in dry pBR322 plasmid using long read sequencing and Monte Carlo simulations, P. Beaudier et al., Sc. Rep. 14 (2024) 18650 - link