molecular-docs
Correction to 2018 Publication
NOTE: These corrections are produced using the same chemistry as in the the original work from 2018. Since this time, the Geant4 chemistry and physics models have been updated, more recent simulations will not produce these results.
As part of the process of preparing for the open source release of this geometry, an error was noted in Lampe et al.’s 2018 work.
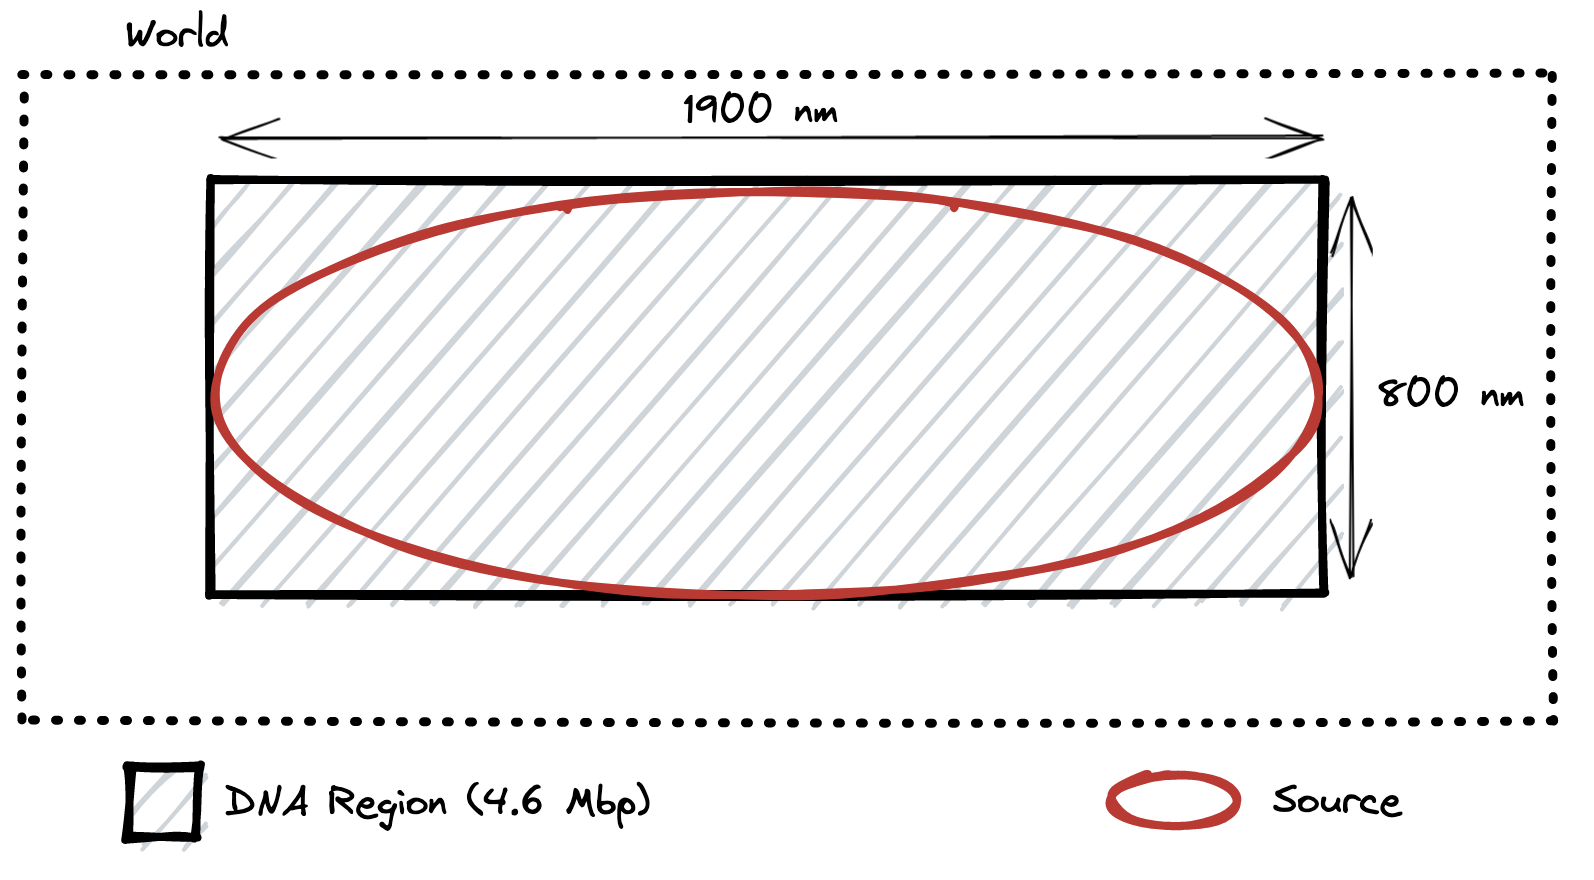
Due to a bug in the code, the geometry that was actually simulated was a rectangular DNA region with an ellipsoidal source, as below:
 \
\
The mathematics in the paper however assumed the ellipsoidal cell shape as described in
the work, resulting in an increase of the density of DNA modelled from the true value
of
Correction Geometries
To explore this, we have created three geometries to investigate the consequences of this error.
Correct Geometry
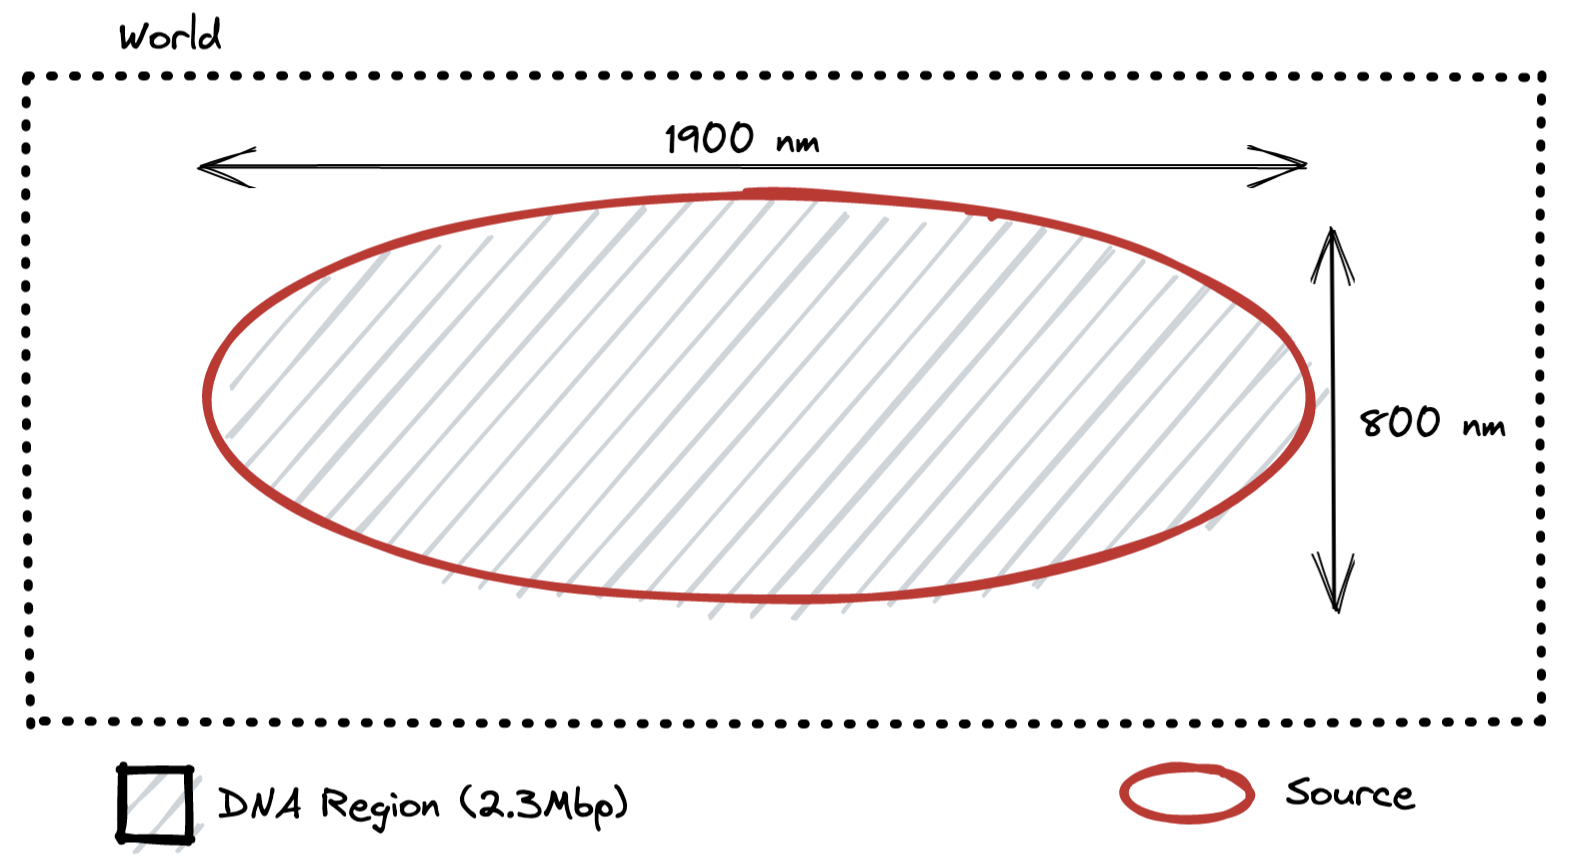
This is what should have been simulated in our 2018 paper. The density of DNA in this
simulation is
Original Geometry
This is the geometry that was actually modelled in the original 2018 paper, as presented above.
Low Density Geometry
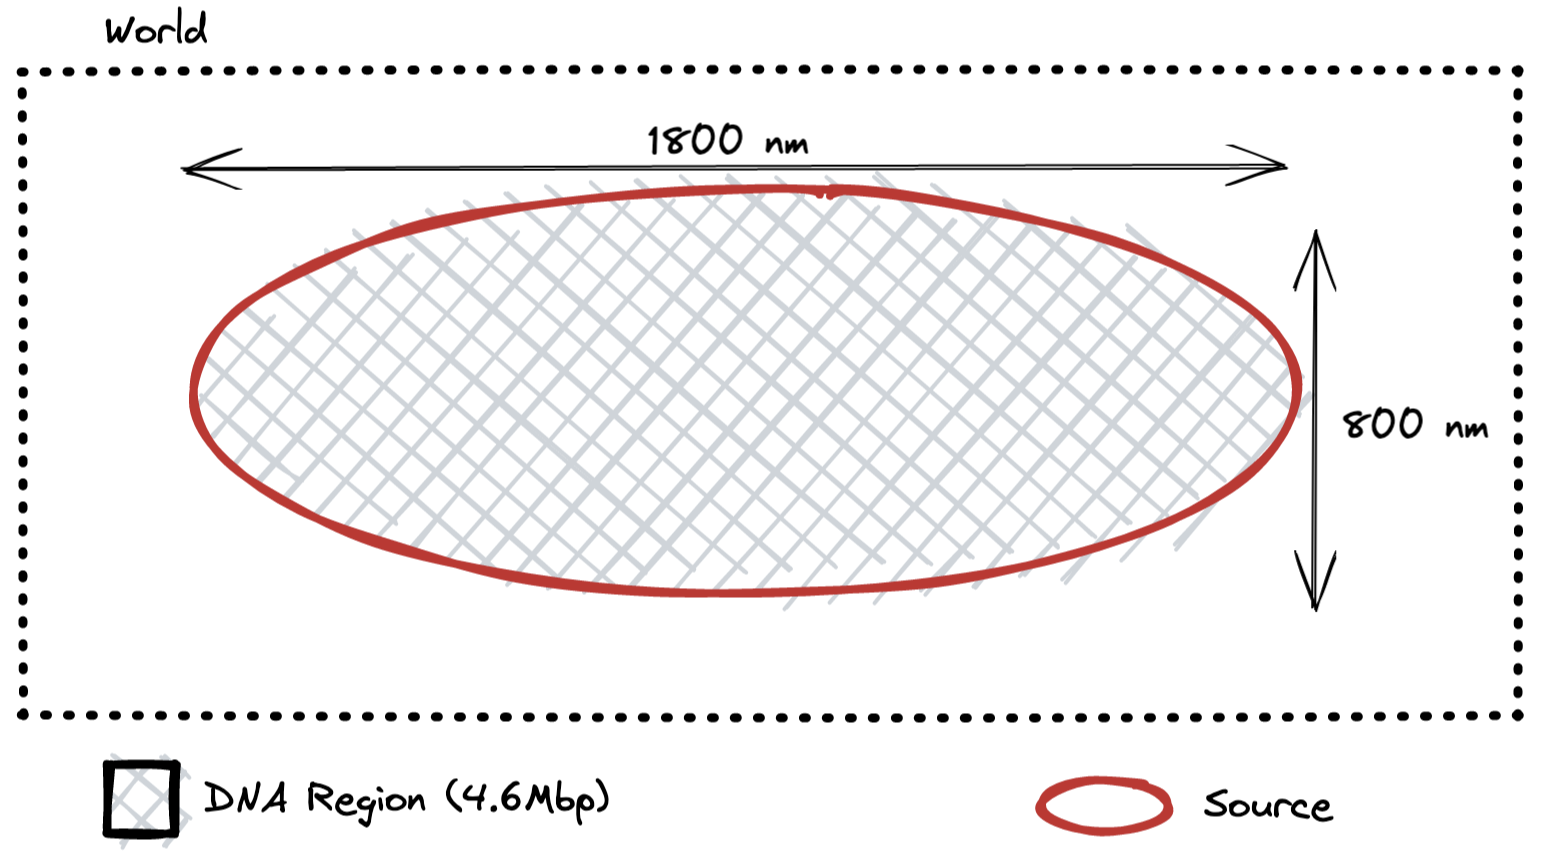
This is a geometry that parallels exactly the geometry simulated in the 2018 work without exceeding the ellipsoidal boundary. It is useful to see whether the DNA at the edge of the ellipse caused an impact to the simulation results.
Correction Results
Across these 3 geometries when considering electrons (Figure 7 in the original work), we see that the three geometries actually produce reasonably similar damage yields:

Compared to the original paper, the results which only consider radical activity within the hydration shell of DNA (radical kill distance of 1nm) provide a better match to experimental results, while the 4nm kill distance overstates damage.
The original study results are shown here (see Figure 7 herein), and indicate damage yields about half of what we see in the corrected results.

When comparing ratios of strand breaks in the new geometry, we do see a slight increase in the DSB/SSB ratio (see Figure 8 herein):
| Original Work | Corrected Geometry |
|---|---|
 |
 |